- Worksheets
- Games
- Lesson Plans
- Workbooks
- Exercises
- Science Projects
- Skills Progression
- More
Search Data and Graphing Lesson Plans
5 filtered results
5 filtered results
Data and Graphing
Sort by

Sub Plans for Second Grade
Lesson Plan
Sub Plans for Second Grade
Sub plans just got a whole lot easier! In this second grade, week-long sub packet, subs can supercharge learning with "All About Me" themed lessons and activities. The “All About Me” theme is the perfect opportunity to reinforce foundational skills like understanding character traits, taking and interpreting meaningful data, and writing from the heart.
2nd grade
Reading & Writing
Lesson Plan
Sub Plans for Kindergarten
Lesson Plan
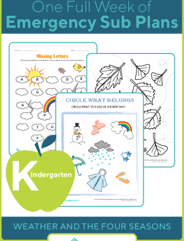
Sub Plans for Kindergarten
Planning for a substitute in the classroom has never been easier than with this kindergarten, week-long sub packet! Your substitute can supercharge learning with lessons about the weather and four seasons to educate and inspire students!
Kindergarten
Math
Lesson Plan