Science project
Which Fruit Has the Most Vitamin C?
Vitamin C (ascorbic acid) is an antioxidant that is essential for human nutrition. Vitamin C deficiency can lead to a disease called scurvy, which is characterized by abnormalities in the bones and teeth. Many fruits and vegetables contain vitamin C.
Fruits have varying levels of vitamin C. In some fruits, the amount of vitamin C varies between different varieties of the same species. The vitamin C content of many fruits is higher when it is slightly unripe, and declines as the fruit becomes ripe. Vitamin C content also decreases with storage.
Tincture of iodine is brownish-red in color. When vitamin C is added, it becomes colorless. This reaction can be used to test for the presence of vitamin C and to give some idea of the amount that can be found in a given substance.
Problem:
Which fruit has the most vitamin C (ascorbic acid)?
Materials
- Fruit or juices from a lemon, apple, grapefruit, kiwifruit, pineapple, pear, and orange
- Tincture of iodine
- 100 mg vitamin C pills
- Medicine droppers
- 500 ml water container
- Set 8 oz clear plastic cups
Safety: Tincture of iodine is poisonous and therefore should not be ingested. If iodine gets into eyes, immediately flush with plenty of water. Continue for at least ten minutes and call for medical help. In case of skin contact, wash off with soap and water. Remove any contaminated clothing. If the skin reddens or appears damaged, call for medical aid. Do not consume any of the juices and /or fruits connected with this project.
Procedure
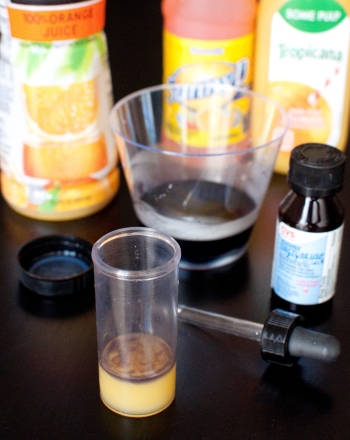
- Prepare an iodine solution by mixing a bottle of tincture of iodine in about 500 ml of water. Place equal amounts of the iodine solution in plastic cups.
- Using a spoon, crush a vitamin C tablet and then dissolve it in water (this will be the control).
- Place equal amounts of the various fruit juices in plastic cups.
- Using the medicine dropper first add the vitamin C control solution drop by drop to a cup of iodine and record the results. Do not to dip the medicine dropper into the iodine.
- Next, add a juice using a different medicine dropper, drop by drop, to a fresh cup of iodine. Swirl the cup after each drop is added.
- Count the number of drops you add until a color change is seen.
- Record the number of drops needed to change the iodine from its brownish-red color to a clear or almost clear color.
- Repeat the procedure using each of the juices.
- Arrange data in numerical order, from the lowest to highest vitamin C content in a table similar to the one shown below.
- Test each juice three times and calculate the average number of drops required to change the color.
|
Name of Juice |
Number of Drops |
|
Control
Lemon
Apple
Grapefruit
Kiwifruit
Pineapple
Pear
Orange
|
|
- Using the data in the table plot a bar graph of Vitamin C Amount (I2 drops/Juice) along the Y-axis verses the names of the juices tested along the X-axis.
- The data in the table might be further organized as a frequency distribution. The frequency with which each measurement occurs is noted in the table below, this way the original raw data can be treated graphically. See example below:
| Drops per Juice | Tally | Frequency |
| 40 | I | 1 |
| 35 | I | 1 |
| 30 | I | 1 |
| 20 | III | 3 |
| 15 | II | 2 |
| 12 | I | 1 |
| 10 | I | 1 |
- Plot a statistical histogram graph similar to the graph shown.

Education.com provides the Science Fair Project Ideas for informational purposes only. Education.com does not make any guarantee or representation regarding the Science Fair Project Ideas and is not responsible or liable for any loss or damage, directly or indirectly, caused by your use of such information. By accessing the Science Fair Project Ideas, you waive and renounce any claims against Education.com that arise thereof. In addition, your access to Education.com's website and Science Fair Project Ideas is covered by Education.com's Privacy Policy and site Terms of Use, which include limitations on Education.com's liability.
Warning is hereby given that not all Project Ideas are appropriate for all individuals or in all circumstances. Implementation of any Science Project Idea should be undertaken only in appropriate settings and with appropriate parental or other supervision. Reading and following the safety precautions of all materials used in a project is the sole responsibility of each individual. For further information, consult your state's handbook of Science Safety.
Related learning resources